From zero to hero in 20′
In this tutorial we will setup a local OpenTelemetry stack for helix services. Then, we will create our first helix service in Go: a HTTP API exposing a single endpoint. Finally, we will create a second helix service, with a publish/subscribe mechanism between the two services.
At the end, you will be able to see how easy it is to use helix and how helix can automate most of your counterproductive tasks when working with multiple services.
TLDR; Source code is on GitHub
Source code of this guide is available in the platform-starter repository on GitHub.
Local OpenTelemetry
To fully appreciate the power of helix, you should have an OpenTelemetry stack running. If you don't, the best way to do so is to use the Docker environment made for this guide: docker-opentelemetry. If you already have one, you can skip this section and move on to the next.
Before going further
If you are not familiar with OpenTelemetry, I first suggest to read a bit about it on the OpenTelemetry website.
This repository is a Docker environment for running an OpenTelemetry stack locally using:
- Prometheus for metrics;
- Mimir as Prometheus long-term storage;
- Loki for logs;
- Tempo for traces;
- Grafana Agent as telemetry collector;
- Grafana for visualization;
- MinIO as storage for Mimir, Loki, Tempo.
The goal is to provide the "simplest" and "lightest" setup possible for running these components together. This means no authentication, no HA configuration, no load-balancer, no TLS.
Clone the repository with:
$ git clone git@github.com:nunchistudio/docker-opentelemetry.git
Then, start the Docker environment:
$ cd ./docker-opentelemetry
$ docker compose up -d
At this point you should have all containers running (truncated for better visibility):
$ docker ps

IMAGE                    PORTS
grafana/agent:latest     0.0.0.0:7020-7021->7020-7021/tcp
grafana/grafana:latest   0.0.0.0:3000->3000/tcp
prom/prometheus:latest   0.0.0.0:9090->9090/tcp
grafana/mimir:latest     0.0.0.0:3300->3300/tcp, 8080/tcp
grafana/tempo:latest     0.0.0.0:3200-3201->3200-3201/tcp, 0.0.0.0:50397->7946/tcp
grafana/loki:latest      0.0.0.0:3100->3100/tcp, 0.0.0.0:50398->7946/tcp
minio/minio:latest       0.0.0.0:9000-9001->9000-9001/tcp
You can access the Grafana dashboard at http://localhost:3000. Datasources are already configured to work with Mimir, Loki, and Tempo.
OpenTelemetry collector endpoint is exposed at localhost:7021.
Your first service
helix requires the environment variable OTEL_EXPORTER_OTLP_TRACES_ENDPOINT to properly run. This represents the endpoint for the OpenTelemetry trace collector. If you followed the local setup above, you should run:
$ export OTEL_EXPORTER_OTLP_TRACES_ENDPOINT=localhost:7021
Warning
If the environment variable is not available from a service, traces will not be exported/collected. If this is the case you should see an error like this one (truncated for better visibility):
traces export: connection error: desc = "transport: Error while dialing: dial tcp [::1]:7021"
Now that you're all set with an OpenTelemetry stack, you can write your first helix service. This service will expose a HTTP endpoint on POST /anything, using the REST router integration.
We will create a directory called helix-platform in your $GOPATH, such as:
/Users/username/go/src/github.com/username/helix-platform
Create the directory and initialize a Go workspace:
$ mkdir ./helix-platform && cd ./helix-platform
$ go work init
Create a directory httpapi, and initialize Go modules. This directory will hold the source of the HTTP API service:
$ mkdir -p ./services/httpapi && cd ./services/httpapi
$ go mod init
Make sure to add the service to the Go workspace. At the root path of the project, run:
$ go work use ./services/*
In the httpapi directory, create a service.go. It contains the source code related to create, start, and close a helix service:
package main

import (
  "net/http"

  "go.nunchi.studio/helix/integration/rest"
  "go.nunchi.studio/helix/service"
)

/*
App holds the different components needed to run our Go service. In this
case, it only holds a REST router for now.
*/
type App struct {
  REST rest.REST
}

/*
app is the instance of App currently running.
*/
var app *App

/*
NewAndStart creates a new helix service and starts it.
*/
func NewAndStart() error {

  // First, create a new REST router. We keep empty config but feel free to
  // dive more later for configuring OpenAPI behavior.
  router, err := rest.New(rest.Config{})
  if err != nil {
    return err
  }

  // Build app with the router created.
  app = &App{
    REST: router,
  }

  // Add a simple route, returning a 202 HTTP response.
  router.POST("/anything", func(rw http.ResponseWriter, req *http.Request) {
    rest.WriteAccepted(rw, req)
  })

  // Start the service using the helix's service package. Only one helix service
  // must be running per process. This is a blocking operation.
  err = service.Start()
  if err != nil {
    return err
  }

  return nil
}

/*
Close tries to gracefully close the helix service. This will automatically close
all connections of each integration when applicable. You can add other logic as
well here.
*/
func (app *App) Close() error {
  err := service.Close()
  if err != nil {
    return err
  }

  return nil
}
Call the NewAndStart and Close functions from main.go:
package main

/*
main is the entrypoint of our app.
*/
func main() {

  // Create and start the service.
  err := NewAndStart()
  if err != nil {
    panic(err)
  }

  // Try to close the service when done.
  err = app.Close()
  if err != nil {
    panic(err)
  }
}
We need to ensure Go dependencies are present. At the root path of the project, run:
$ go work sync
Run the service with:
$ go run ./services/httpapi
You now have a helix service up and running, exposing a HTTP API on http://localhost:8080. Let's try to request the POST /anything endpoint:
$ curl --request POST \
  --url http://localhost:8080/anything \
  --header 'Content-Type: application/json'
The JSON response should be:
{
  "status": "Accepted"
}
In Grafana, go to the "Explore" section at http://localhost:3000/explore. Select "Tempo" as datasource, and search for traces in httpapi service. You should see your first trace:
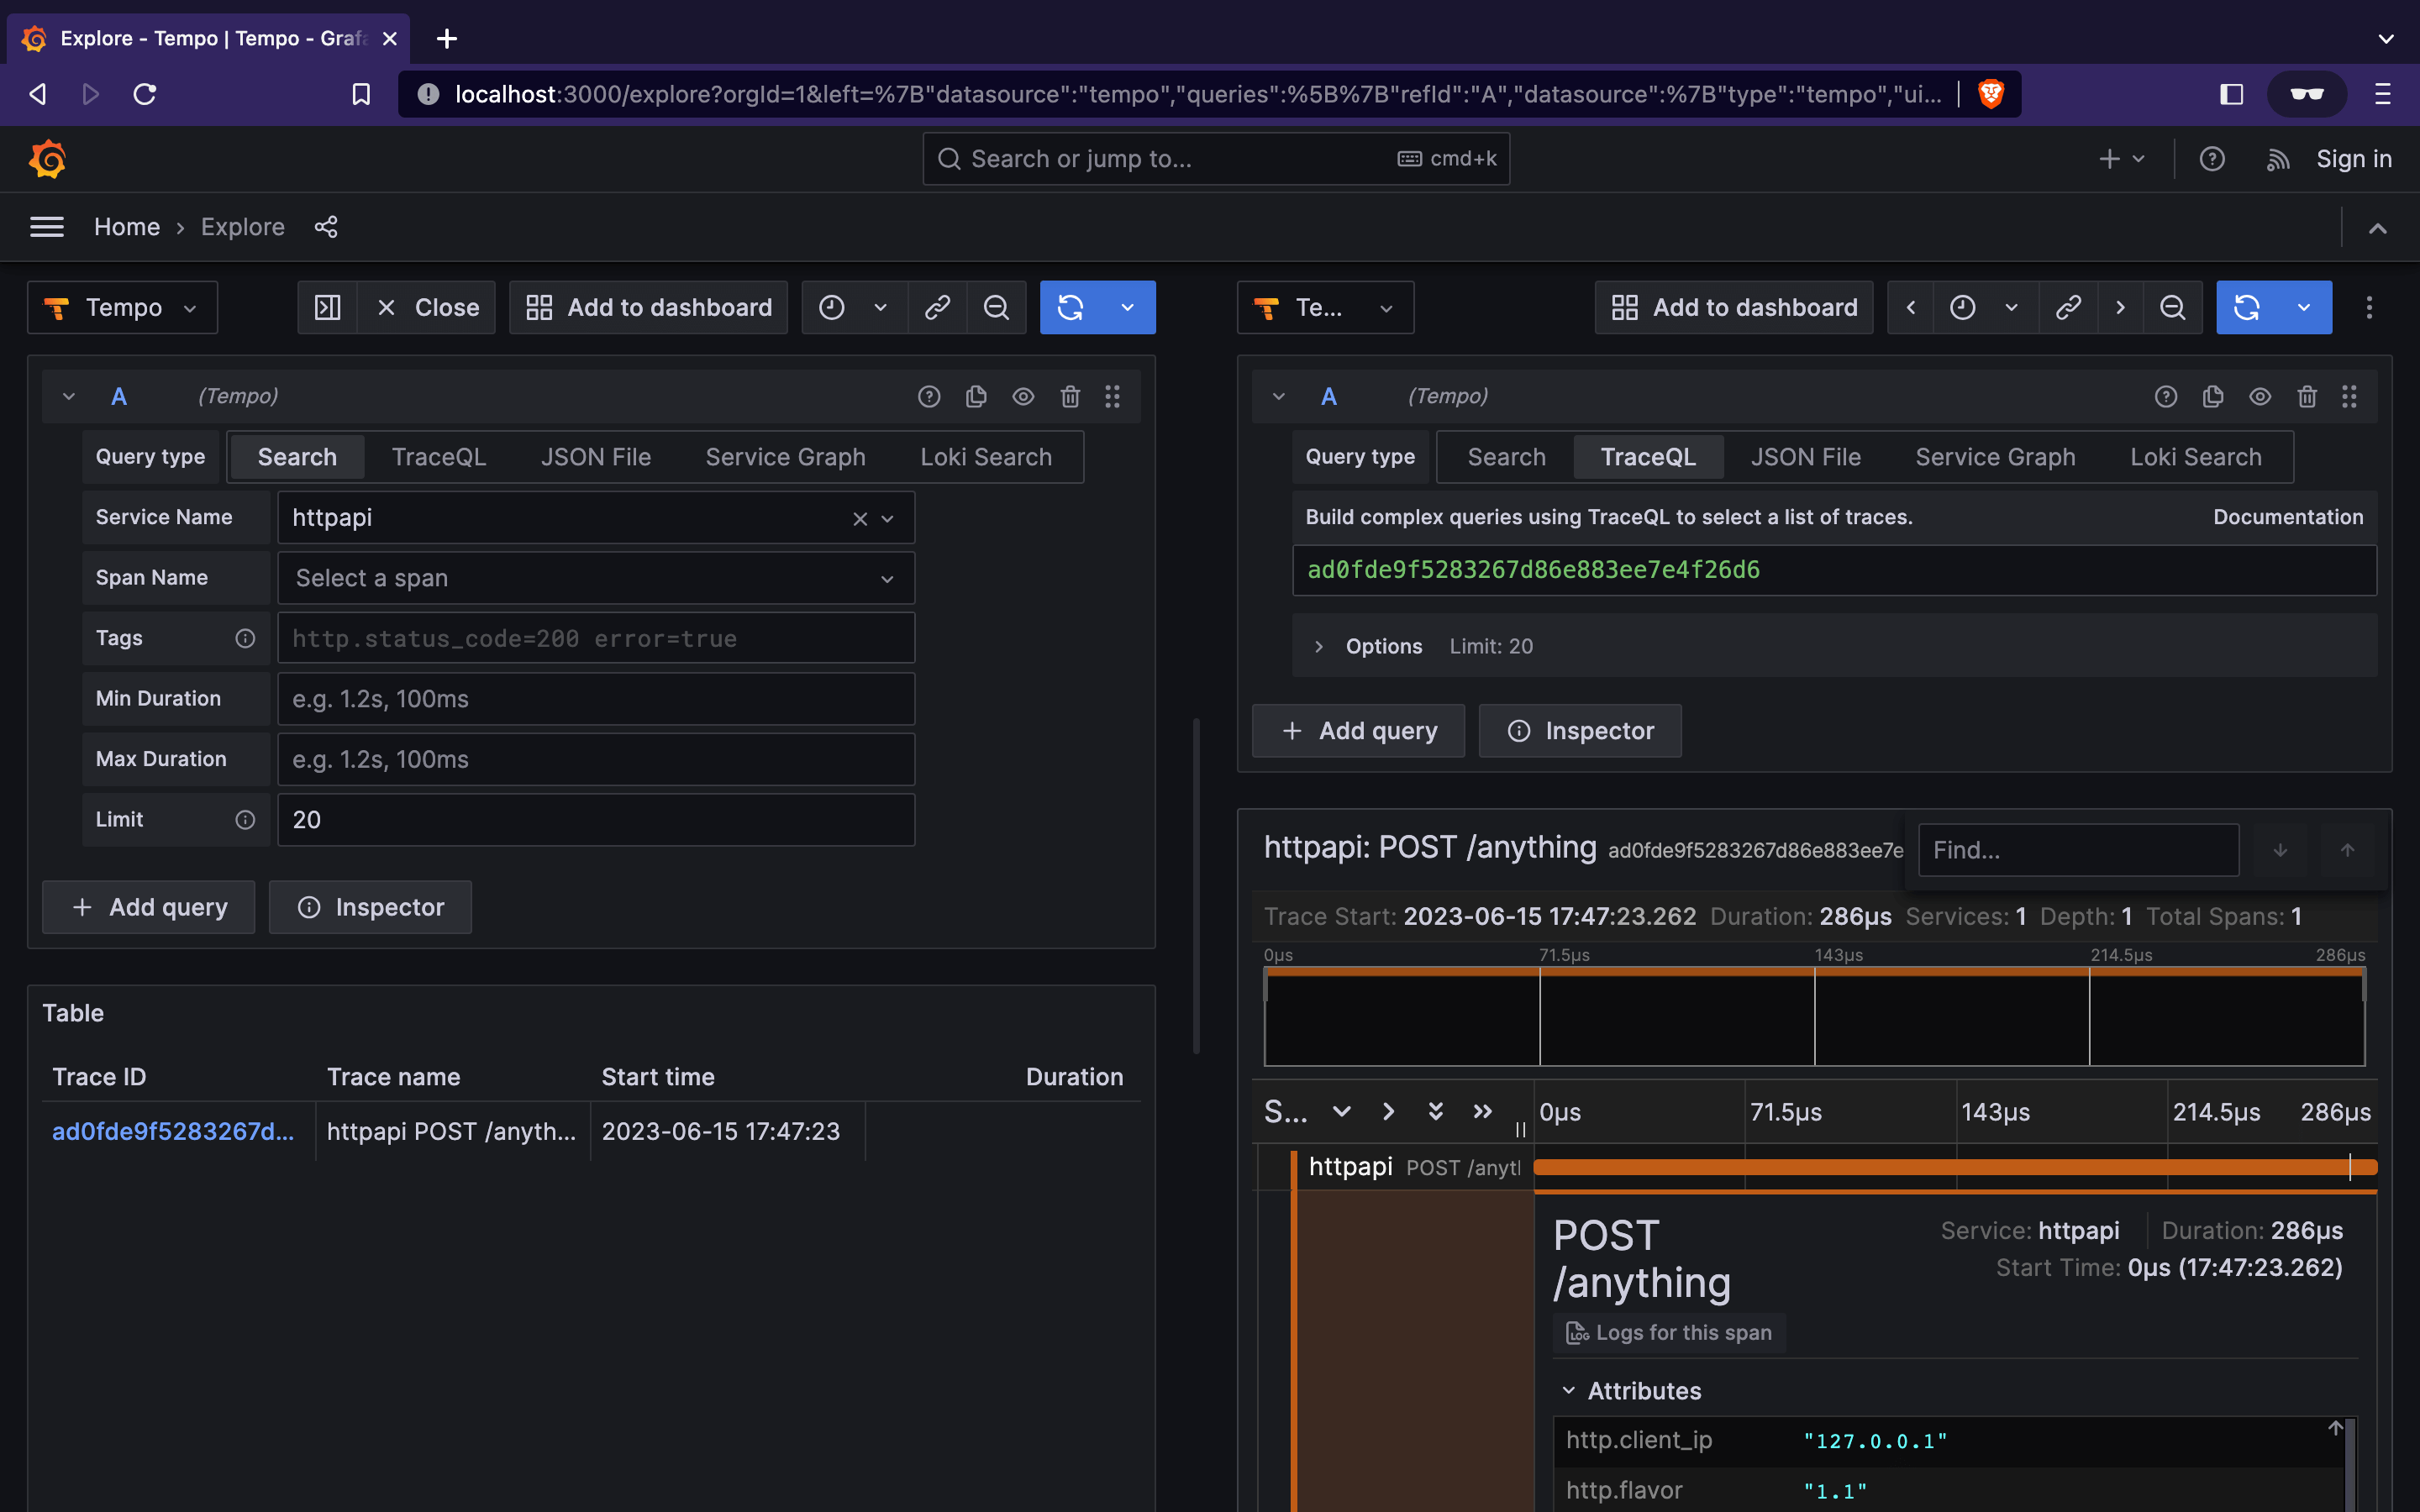
It's important to notice here that the only observability step we did on the application side is to set the environment variable OTEL_EXPORTER_OTLP_TRACES_ENDPOINT. Other than that, tracing was fully automated!
This is only the beginning. We'll now discover automatic distributed tracing and error recording with event propagation across services.
Example with NATS JetStream
Running NATS locally
To leverage the NATS JetStream integration, we must have a NATS server up and running with JetStream enabled. Let's start one with Docker:
$ docker run -d -p 4222:4222 nats -js
Publish from the HTTP API
The httpapi service will publish a message via NATS JetStream on each and every HTTP requests made against the endpoint created earlier.
To do that, we need to add the NATS JetStream integration to the httpapi service, and add the business logic to publish a message in the handler function.
Let's see how service.go shall now look:
package main

import (
  "net/http"

  "go.nunchi.studio/helix/event"
  "go.nunchi.studio/helix/integration/nats"
  "go.nunchi.studio/helix/integration/rest"
  "go.nunchi.studio/helix/service"
)

/*
App holds the different components needed to run our Go service. In this
case, it holds a REST router and NATS JetStream context.
*/
type App struct {
  REST      rest.REST
  JetStream nats.JetStream
}

/*
app is the instance of App currently running.
*/
var app *App

/*
NewAndStart creates a new helix service and starts it.
*/
func NewAndStart() error {

  // First, create a new REST router. We keep empty config but feel free to
  // dive more later for configuring OpenAPI behavior.
  router, err := rest.New(rest.Config{})
  if err != nil {
    return err
  }

  // Then, create a new NATS JetStream context. We keep empty config but feel
  // free to dive more later for advanced configuration.
  js, err := nats.Connect(nats.Config{})
  if err != nil {
    return err
  }

  // Build app with the router created.
  app = &App{
    REST:      router,
    JetStream: js,
  }

  // Add a route, returning a 202 HTTP response. When a request is made, publish
  // a message. We use static data for demo purpose. In the demo below, we create
  // an Event object using the event package. We then create a new context.Context
  // by calling event.ContextWithEvent. This returns a new context including the
  // event created. helix integrations automatically read/write an Event from/into
  // a context when possible. The integration then passes the Event in the
  // appropriate headers. In this case, the NATS JetStream integration achieves
  // this by passing and reading an Event from the messages' headers.
  router.POST("/anything", func(rw http.ResponseWriter, req *http.Request) {
    var e = event.Event{
      Name:   "post.anything",
      UserID: "7469e788-617a-4b6a-8a26-a61f6acd01d3",
      Subscriptions: []event.Subscription{
        {
          CustomerID:  "2658da04-7c8f-4a7e-9ab0-d5d555b8173e",
          PlanID:      "7781028b-eb48-410d-8cae-c36cffed663d",
          Usage:       "api.requests",
          IncrementBy: 1.0,
        },
      },
    }

    ctx := event.ContextWithEvent(req.Context(), e)
    msg := &nats.Msg{
      Subject: "demo",
      Sub: &nats.Subscription{
        Queue: "demo-queue",
      },
      Data: []byte(`{ "hello": "world" }`),
    }

    js.Publish(ctx, msg)

    rest.WriteAccepted(rw, req)
  })

  // Start the service using the helix's service package. Only one helix service
  // must be running per process. This is a blocking operation.
  err = service.Start()
  if err != nil {
    return err
  }

  return nil
}

/*
Close tries to gracefully close the helix service. This will automatically close
all connections of each integration when applicable. You can add other logic as
well here.
*/
func (app *App) Close() error {
  err := service.Close()
  if err != nil {
    return err
  }

  return nil
}
Your second service
The second service, which will be called subscriber, will subscribe to the NATS JetStream subject and receive all messages of the said subject. In this demo, all messages received will come from the HTTP endpoint of the httpapi service.
Create a directory subscriber, and initialize Go modules. This directory will hold the source of the NATS subscription service:
$ mkdir -p ./services/subscriber && cd ./services/subscriber
$ go mod init
Just like for the first service, make sure to add the service to the Go workspace. At the root path of the project, run:
$ go work use ./services/*
In the subscriber directory, create a service.go. It contains the source code related to create, start, and close a helix service:
package main

import (
  "context"
  "errors"

  "go.nunchi.studio/helix/integration/nats"
  "go.nunchi.studio/helix/service"
  "go.nunchi.studio/helix/telemetry/trace"

  "github.com/nats-io/nats.go/jetstream"
)

/*
App holds the different components needed to run our Go service. In this
case, it only holds a NATS JetStream context.
*/
type App struct {
  JetStream nats.JetStream
}

/*
app is the instance of App currently running.
*/
var app *App

/*
NewAndStart creates a new helix service and starts it.
*/
func NewAndStart() error {

  // First, create a new NATS JetStream context. We keep empty config but feel
  // free to dive more later for advanced configuration.
  js, err := nats.Connect(nats.Config{})
  if err != nil {
    return err
  }

  // Build app with the NATS JetStream context created.
  app = &App{
    JetStream: js,
  }

  // Create a new stream in NATS JetStream called "demo-stream", for subject "demo".
  stream, _ := js.CreateOrUpdateStream(context.Background(), jetstream.StreamConfig{
    Name:     "demo-stream",
    Subjects: []string{"demo"},
  })

  // Create a new NATS JetStream consumer called "demo-queue".
  consumer, _ := stream.CreateOrUpdateConsumer(context.Background(), jetstream.ConsumerConfig{
    Name: "demo-queue",
  })

  // Create a new, empty context.
  ctx := context.Background()

  // Start consuming messages from the queue "demo-queue" on subject "demo". We
  // pass the empty context previously created. The context in the callback
  // function is a copy of one the passed, but now contains the Event object at
  // the origin of the trace (if any). You can also create your own span, which
  // will be a child span of the trace found in the context (if any). In our case,
  // the context includes Event created during the HTTP request, as well as the
  // trace handled by the REST router. At any point in time, you can record an
  // error in the span, which will be reported back to the root span.
  consumer.Consume(ctx, func(ctx context.Context, msg jetstream.Msg) {
    _, span := trace.Start(ctx, trace.SpanKindConsumer, "Custom Span")
    defer span.End()

    if 2+2 == 4 {
      span.RecordError("this is a demo error based on a dummy condition", errors.New("any error"))
    }

    msg.Ack()
  })

  // Start the service using the helix's service package. Only one helix service
  // must be running per process. This is a blocking operation.
  err = service.Start()
  if err != nil {
    return err
  }

  return nil
}

/*
Close tries to gracefully close the helix service. This will automatically close
all connections of each integration when applicable. You can add other logic as
well here.
*/
func (app *App) Close() error {
  err := service.Close()
  if err != nil {
    return err
  }

  return nil
}
Call the NewAndStart and Close functions from main.go:
package main

/*
main is the entrypoint of our app.
*/
func main() {

  // Create and start the service.
  err := NewAndStart()
  if err != nil {
    panic(err)
  }

  // Try to close the service when done.
  err = app.Close()
  if err != nil {
    panic(err)
  }
}
We need to ensure Go dependencies are present. At the root path of the project, run:
$ go work sync
Event propagation in action
Now, in two different terminals, let's start our two services:
$ go run ./services/httpapi
And:
$ go run ./services/subscriber
Make a new request against the HTTP endpoint created earlier, now publishing a message:
$ curl --request POST \
  --url http://localhost:8080/anything \
  --header 'Content-Type: application/json'
Let's see how it looks in Grafana "Explore" section:
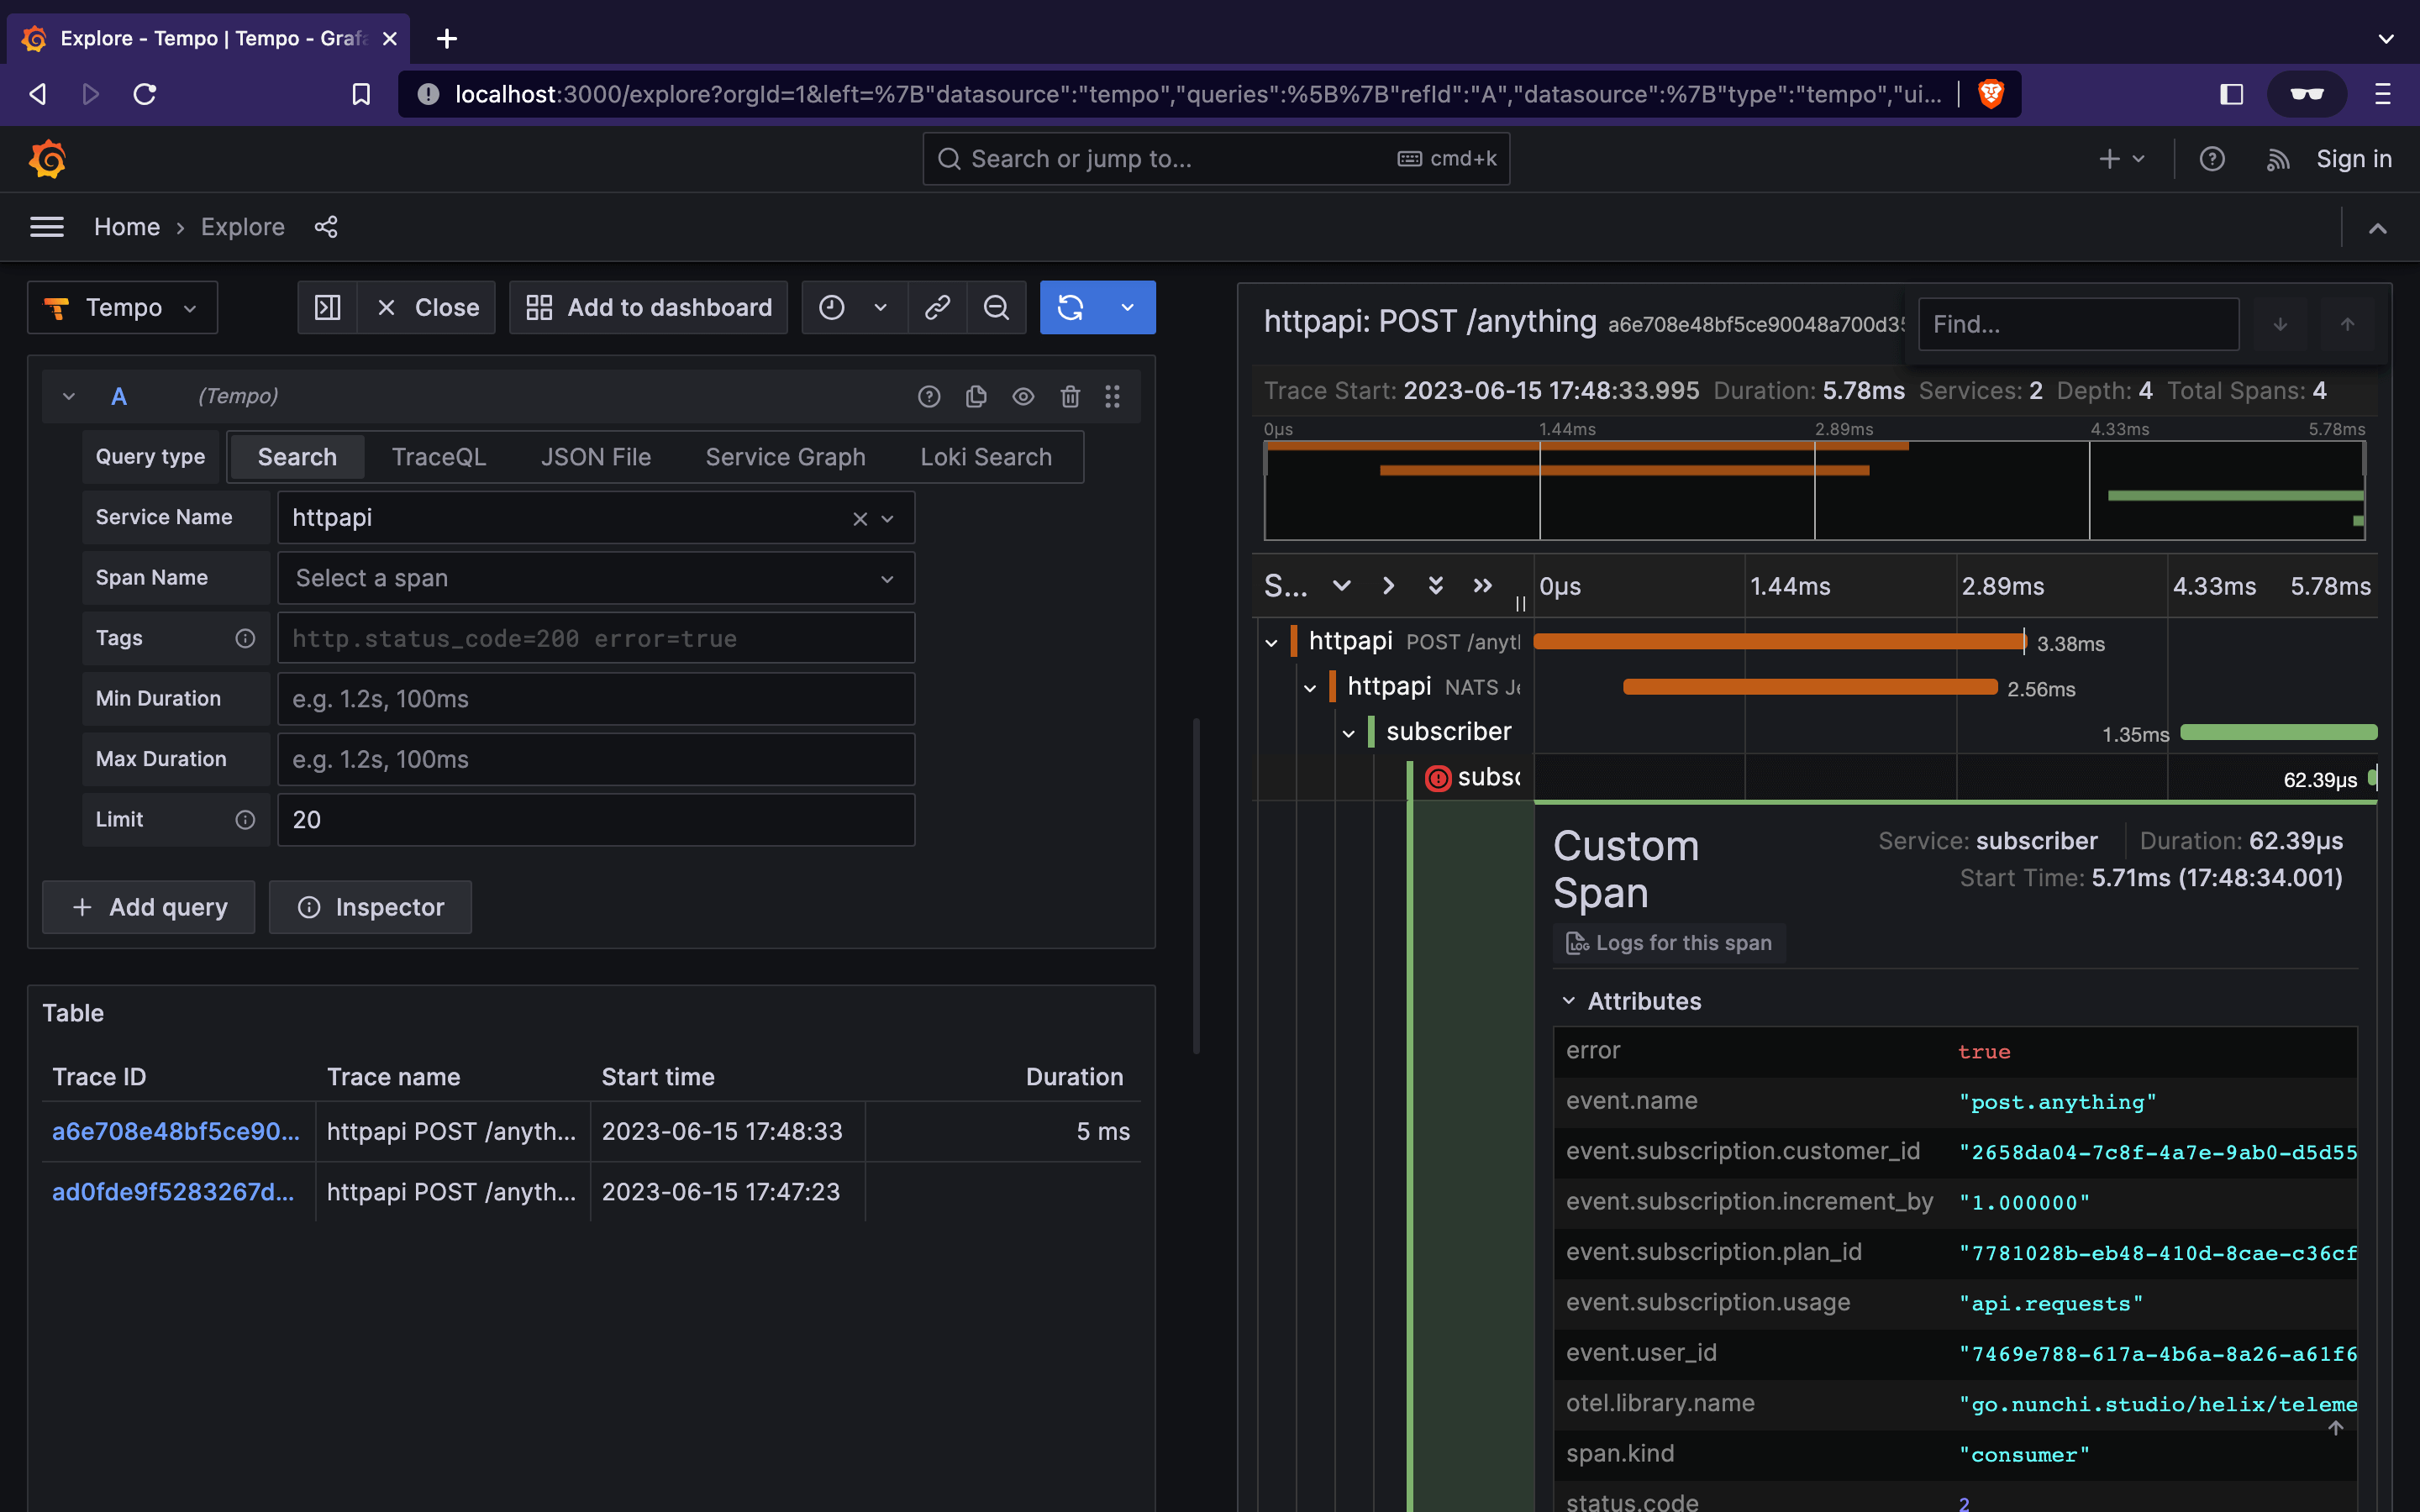
As you can notice, the span Custom Span created in the NATS subscription has been added as a child span of the subscription, which itself is a child of the one publishing the message. We can see the Event object has been propagated as well across these two services.
Also, the NATS JetStream integration has automatically added trace attributes, such as the queue and subject.
Congratulations!
You just leveraged helix power to embrace automatic observability across services within your stack!
Next steps
To go a bit further with this example and discover helix step-by-step, you could:
- Enable and configure OpenAPI validation for the REST router in the
httpapiservice; - Add another integration in the
subscriberservice (such as PostgreSQL); - Run both services in Docker containers to explore logs using the Loki datasource in Grafana.
